Census Tract Splits from 2010 to 2020
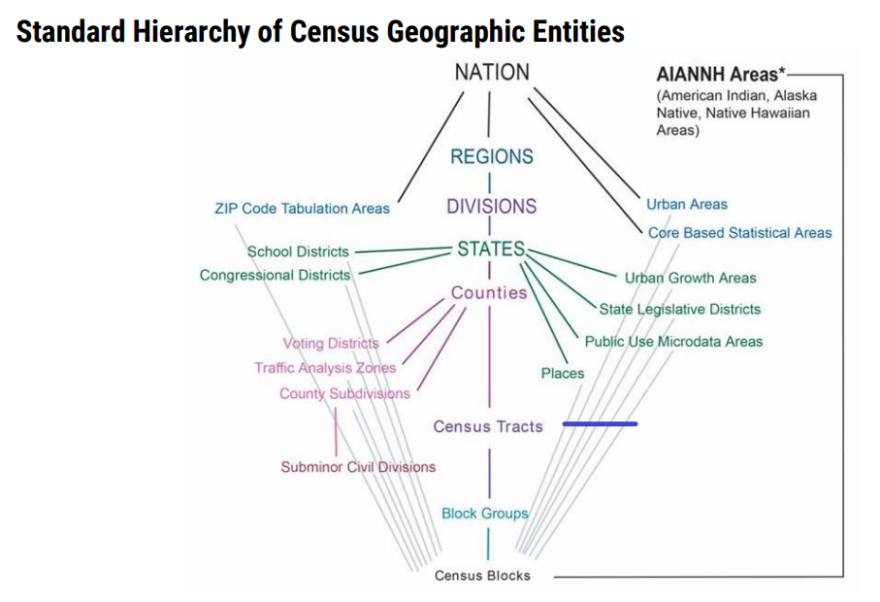
The Census Bureau defines census tracts as smaller subdivisions within a county; the boundaries change every ten years. The purpose of these tracts, according to the Bureau, is to provide a “stable set of geographic units for the presentation of statistical data.”

After the 2020 Census, there are ten new census tracts in New Hanover County. That brings the total number of tracts from 46 to 56.
Dr. Anna Casey is a data scientist with Cape Fear Collective. She said the reason why having this information is important — politicians, community organizers, and non-profit organizations can understand the county’s demographic information at a more “granular [level].” And that these tract splits can “unmask previously hidden disparities and demographic clustering.”
Casey said that the Census Bureau tries to keep tracts at a certain threshold, around 4,000 people. So, if more people move into a tract over a decade, the Bureau will then split the tract. But if more people move out, the Bureau would then merge the tract with another.
In New Hanover and Brunswick counties, there were no merges, only splits; Pender County did see one merge, near Topsail Beach.

To highlight some of the New Hanover County tract changes from 2010 to 2020, Casey said that Tract 115, which encompasses county neighborhoods around the 421 Corridor, Wrightsboro, and Castle Hayne Road, was about 72% white, non-Hispanic (See A on map). Now that the tract has split in 2020 into 115.03 (See A, darker color to the west) and 115.04 (See A, lighter color to the east), the former is now significantly less white, non-Hispanic at 49% and the latter became more white, non-Hispanic at 74%.
For Tract 116.03 (See B on map), which encompasses developments around Blue Clay and North College Roads, Castle Hayne, and Murrayville, was 77% white, non-Hispanic. This tract has now split into 116.09 (See B, darker color to the south) and 116.10 (See B, lighter color to the north). These splits have made these tracts less white, non-Hispanic, at 71%, and 63% respectively.
For these two tracts in the northern part of the county that have split, Casey said they are now significantly less white, which could stem from more diverse populations moving there or they could just reveal who is living in these communities at a more granular level.
For Tract 120.01(See C on map), which was 79% white, non-Hispanic, the tract has split along the lines of the ‘unofficial’ City of Wilmington’s neighborhood planning area of Seagate South (120.11, darker color to the west) and Greenville Loop neighborhood area (120.12, lighter color to the east). The Seagate South area has now become less white, non-Hispanic (71%) and Greenville Loop is more white, non-Hispanic at 93%.

Casey said that this change could be that more white people have moved into the Greenville Loop area or that the split has allowed researchers to see what’s always been there, a significant white population living in this part of the county.
Major NHC Demographic Changes from 2010 to 2020
New Hanover County gained roughly 23,000 people, which is about an 11% increase in its population over a decade.
New Hanover County housing levels, both vacant and occupied units have increased by 12% from 2010. Casey said that translates to roughly 12,000 new housing units over the past 10 years. For just occupied housing, it was a 14% increase. So it appears, Casey said, that in the county, the number of housing units available hasn’t kept pace with the number of people moving here.
As for changes in racial demographics, Casey said there have been national headlines about the Census figures showing the white population declining and the multiracial population increasing. But some of this change, according to Casey, as highlighted by an October NPR Code Switch episode, is due to people developing more complex identities through DNA testing, potentially leading people to claim a multi-racial identity.
In 2010, in New Hanover County, roughly 2% of the population reported being multi-racial, which has now increased in 2020 to 6%, which is about 15,000 more people identifying as two or more races.
According to Casey, the white population has grown by about 10,000 people or 7% since 2010. For people who identify as Asian, that was a 46% increase, which translates to about 1,110 more identifying as ‘Asian alone.’
The largest increase was people reporting ‘some other race alone’ — that’s a box people could check if they didn’t identify as white, Black, Native American, Asian, or Pacific Islander — which saw a 68% increase. This was followed by a 61% increase in the Hispanic or Latino population.
But the only decrease, according to Casey, was the Black population, which shrunk by about 2,500 people, down 8%.
Casey said that she wanted to reiterate that these racial changes need to be put in context: “Demographers and other experts have reasons to believe that it might be misleading to compare some of the racial self-identification in 2020 to that of 2010. While there is certainly growth in the ‘2 or more races’ category, for example, some of that is also a shift in how people are identifying [themselves]. In other words, it could be that more people who are reporting Black alone are now reporting as two or more races, and that might be a part of why we’re seeing the decrease.”
Casey said to “keep in mind people are reporting their own race. How people move through the world isn’t necessarily how they always self-identify, or how other people view them might not always necessarily be how they self-identify.”
The Census Bureau is going to release more detailed demographic information, likely in March 2022. Casey said that with this next data drop, researchers will be able to see with more granularity changes in income and housing characteristics.


